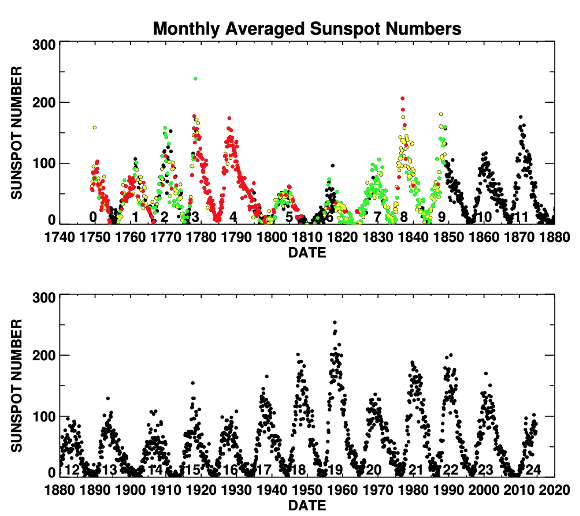
In 1844, Schwabe found that sunspots appear in cycles of about 11 years, a discovery confirmed by other astronomers. This led to the creation of the International Sunspot Number (R), which measures individual sunspots and groups. Since 1849, R is calculated as an average from various observatories around the world.
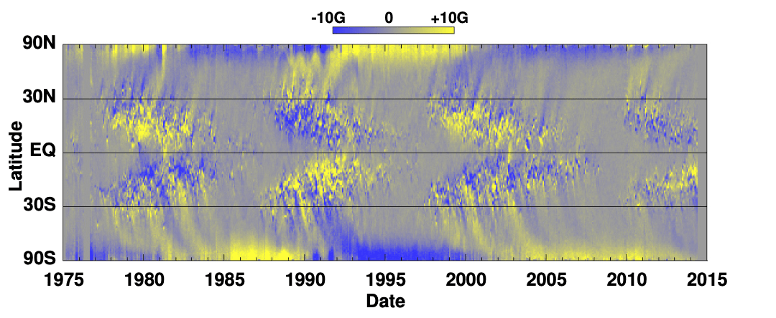
Besides optical observations, a magnetogram can be created by analyzing the magnetic flux on the solar surface. The analysis maps the magnetic flux onto the sun. This method also allows for the observation of sunspots due to their strong vertical magnetic fields. A common way to study their distribution over time is through the “Butterfly diagram.” This diagram shows the characteristic butterfly pattern of sunspots. They appear at higher latitudes at the start of a solar cycle and move toward the equator by the end. The strong magnetic fields at the poles indicate that their polarity reverses at the solar maximum (D. H. Hathaway, 2015).
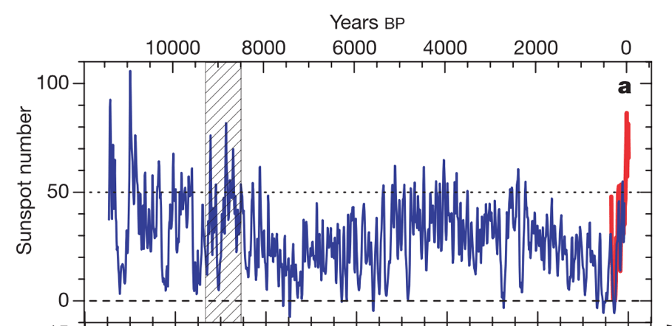
Besides the Schwabe Sunspot Cycle, solar activity changes over different timescales. There are short-term modulations in gamma-ray flare activity every 154 days (Rieger et al., 1984) and about two-year variations (Benevolenskaya, 1995). Additionally, researchers studying solar effects on climate have identified longer cycles. By analyzing radioactive isotopes in tree-rings and ice cores, they found that solar activity can be traced back to the end of the last ice age (S. K. Solanki, Usoskin, Kromer, Schussler, & Beer, 2004). They showed, that the high level of solar activity in the second half of the 20th century was unusual compared to the previous 10,000 years.
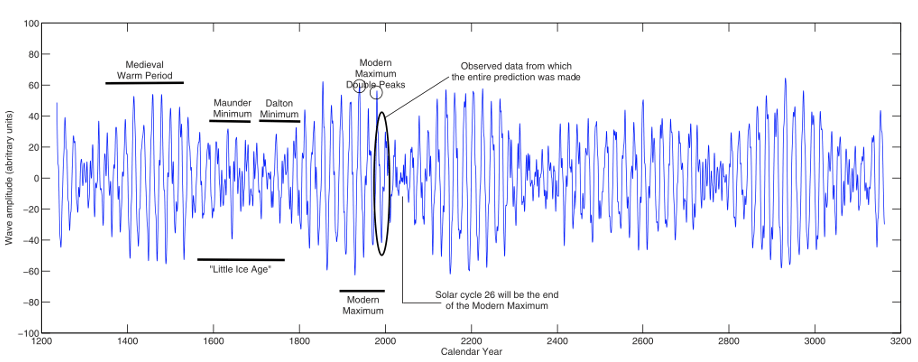
Furthermore, (Zharkova et al., 2015) found through mathematical analysis of solar magnetograms that the long-term behavior of solar activity shows oscillations with a 400-year and 1950-year cycle (Zharkova, Shepherd, Zharkov, & Popova, 2019). As a result, they predicted a Grand Solar Minimum (GSM) in the next 30 years, similar to the Maunder minimum that occurred 400 years ago. During the Maunder minimum, unusual climate conditions and cold temperatures were observed in the northern hemisphere. While the link between low solar activity and these weather conditions is still debated, the health effects of such low solar activity are completely unknown.
Recent low solar activity has had notable effects. As a result, cosmic ray intensity has reached record highs over the past decade (Sodankyla-Geophysical-Observatory, 2019). Read also this post about the link between cosmic rays and solar activity.
In my own research, I examined the relationship between solar activity and blood parameters (Pahlen, 2025). I found that among other parameters, cosmic ray levels have a significant correlation with certain health factors. Their full effects during a grand solar minimum are still not well understood. This lack of understanding is important to consider given the likelihood of further rising cosmic ray levels.

Leave a comment